
Below is the current Sheboygan County Coronavirus Case Dashboard embedded directly from the Sheboygan County website, sheboygancounty.com. This is updated daily at 2 PM, Monday through Friday. You can view it yourself on mobile or desktop. For additional details please visit the Sheboygan County COVID-19 website.
This data takes more than a quick glance to fully analyze because the dashboard misrepresents the Cases Over Time. Was this intentional? Was the goal to create fear?
The bottom left portion of the dashboard provides a stacked bar graph displaying cases over time. This type of graph is inappropriate for this data. The graph on the dashboard depicts blue active cases on the bottom, lime green recovered cases in the middle, and red deaths on the top. So, over time, the graph shows a steep upward trend. However, because the dashboard stacks the data from recovered cases, the upward trend is distorted. You are counting recovered cases as a negative thing.
Not only does this dashboard misrepresent the data, it is also missing a key metric giving a misleading picture of the severity of COVID-19.
We will use the metrics displayed on the dashboard and their values as of 08/27/2020 8:20 AM to demonstrate. The numbers as reflected on the current dashboard are different than these due to the daily updates, but the math will remain the same.
| Total Confirmed Cases | 988 of 27,594 Total Tests | 3.6% Tested Positive |
| Active | 77 of 988 Cases | 7.8% Active |
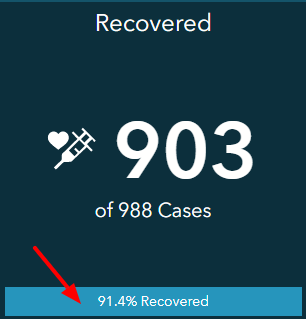
| Recovered | 903 of 988 Cases | 91.4% Recovered |
| Deaths | 8 of 988 Cases | 0.8% Deceased |
| Negative | 26,606 of 27,594 Total Tests | 96.4% Tested |
| Hospitalized | 4 of 77 Cases | 5.2% Hospitalized |
The problem with the data as presented is that there are two main classifications: “Active” and “Resolved”, yet they are mixed inappropriately. Let us show you why.
If we look at the Recovered metric (903 people) we see that this is out of 988 cases. With simple division, taking the Recovered cases and dividing by the Total Confirmed Cases (903/988 = 0.9140) we get a 91.40% Recovered. If people recover in 91.4% of the cases, does this mean that 8.6% do not recover? The answer: NO! Most of the remaining 8.6% will in fact eventually recover. These are the Active cases. The Percent Recovered metric is misleading.
Instead of Percent Recovered, a Recovery Rate metric should be used. This is obtained by using only the Resolved cases. The Resolved cases include those who have recovered and those who have died. We can get the Total Resolved in two ways, Recovered + Deaths = 903 + 8 = 911, or Total Confirmed Cases – Active = 988 – 77 = 911. The Recovery Rate is then calculated by dividing the number of those Recovered by the Total Resolved = 903 / 911 = 0.9912, or 99.12%.
Why does the Sheboygan County Dashboard (on August 27, 2020), reflect a
Recovery of only 91.40% when the Recovery Rate is 99.12%?

So, what is wrong with percent recovered? Why remove the Active cases from the Total Confirmed Cases? It is because these Active cases are neither Recovered nor Deaths, they are unresolved. Once they are no longer active they will be reclassified as only one of two things:
Recovered or Deaths
Recovery rate is the metric that actually shows the percent of those who contract COVID-19 who eventually recover from the virus.
Understanding Mortality Rate
If you were to ask anyone at random which of the metrics being tracked is the most important, you would probably get an overwhelming majority say “Deaths.” Why do we only show a total for deaths but we don’t show the death rate (aka mortality rate)? We closed our entire country down because COVID-19 was believed to be far worse than the flu. So let us review the rate at which people die from COVID.
We have been told that active cases are rising and we should be fearful, wear masks, stay indoors and put your entire life on hold until the election passes (oops, until COVID-19 passes!). Many people have personal experience with the annual flu.
Did you know the CDC reported that in 2017 an estimated 45 million people got sick with influenza, 21 million people went to a health care provider, 810,000 hospitalizations?
an estimated 45 million people getting sick with influenza, 21 million people going to a health care provider, 810,000 hospitalizations
U.S. Department of Health & Human Services (CDC 2017-2018 Estimated Influenza Illnesses)
The CDC also reports that there were 55,672 deaths from influenza and pneumonia with a mortality rate of 17.1 per 100,000 population (0.0171%) [National Vital Statistics Reports, Volume 68, Number 9, “Deaths, Final Data for 2017”, https://www.cdc.gov/nchs/data/nvsr/nvsr68/nvsr68_09-508.pdf
When COVID began spreading throughout our country we shut down our entire country because the mortality rate was estimated to be as high as 4%, which is over 230 times that of the seasonal flu mortality rate. That is why we shut EVERYTHING down.
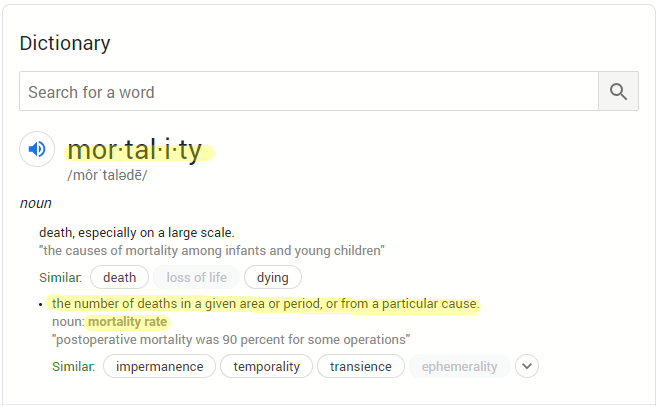
Mortality rate is defined as the number of deaths in a given area or period, or from a particular cause. For the case of this article when we say mortality rate we are talking about the COVID-19 mortality rate, those deaths from COVID-19.
How do we compute Sheboygan County’s COVID mortality rate?
The CDC measures the mortality rate as deaths per 100,000 population. Applying the calculation to Sheboygan County which has a population of about 100,000, we have a mortality rate of 0.008%, less than half the influenza and pneumonia fatality rate from the CDC. While we can expect a few more COVID deaths, it seems COVID is no worse than a typical flu.
If the fatality rate from COVID is this low, then that raises some hard questions that each of us should be asking.

Hard questions
If this is about safety, why are we not focused on the real data, such as the mortality rate; instead we are concerned with creating fear. Why?
If the virus were the only factor, wouldn’t everyone that is infected die?
Hospitalizations and deaths are recorded as “covid cases” if the person tests positive. However, they may be completely asymptomatic and become hospitalized for something else. For example, if someone is in a car accident and is asymptomatic but tests positive, they are now a “covid patient” in the hospital.
How many deaths that were reported as Covid deaths were actually caused by other diseases?
During lockdowns, why are liquor stores allowed to remain open, while clothing stores are closed?
Why are rioters and lawmakers not required to wear masks, but young children are?
Why are schools being closed and children being sent to daycare centers instead?
Why are people forbidden to gather for worship services, yet they are allowed to attend large funerals for public figures?
The information provided on this website does not, and is not intended to, constitute legal advice; instead, all information, content, and materials available on this site are for general informational purposes only. Information on this website may not constitute the most up-to-date legal or other information. This website contains links to other third-party websites. Such links are only for the convenience of the reader, user or browser; We are Sheboygan and its members do not recommend or endorse the contents of the third-party sites.


1 Comment. Leave new
Thank you for stating facts. I have been so angry about the increased covid19 cases we have been fed!!!